One OpenTelemetry Collector, two clouds: Azure Monitor + Google Cloud
Most teams that need telemetry in two clouds end up running two agents on every node: one vendor’s agent for Azure and another’s for Google Cloud. That means two sets of config, two sets of labels that never quite match, and two bills for the same bytes.
We did it with one pipeline. On an AI agent platform running on Kubernetes, the OpenTelemetry Collector sent the same traces, metrics and logs to Azure Monitor and Google Cloud Monitoring at the same time. Applications don’t know either backend exists. This post covers the layout, the config, and what we would change.
Why two backends at all
It is rarely a technical choice. One group lives in the Azure portal and Application Insights, another in the Google Cloud console, and neither is going to switch. The real requirement is: both consoles must show the same request with the same attributes, and adding a third destination later must not mean re-instrumenting anything.
That rules out vendor SDKs in application code. Services emit OTLP to the Collector, and the Collector owns every decision about where telemetry goes.
The shape
Two tiers, both deployed from the upstream opentelemetry-collector Helm chart and reconciled by ArgoCD like everything else on the platform:
- Agent (DaemonSet): one per node. It receives OTLP from pods on the node, scrapes kubelet stats, tails container logs, and adds Kubernetes metadata. It never talks to a cloud backend.
- Gateway (Deployment, 2+ replicas): receives from the agents, filters and batches, and fans out to both exporters. This is the only place that holds credentials.
This split keeps credentials and export logic in a handful of pods instead of on every node, and it gives you one place to change what leaves the cluster.
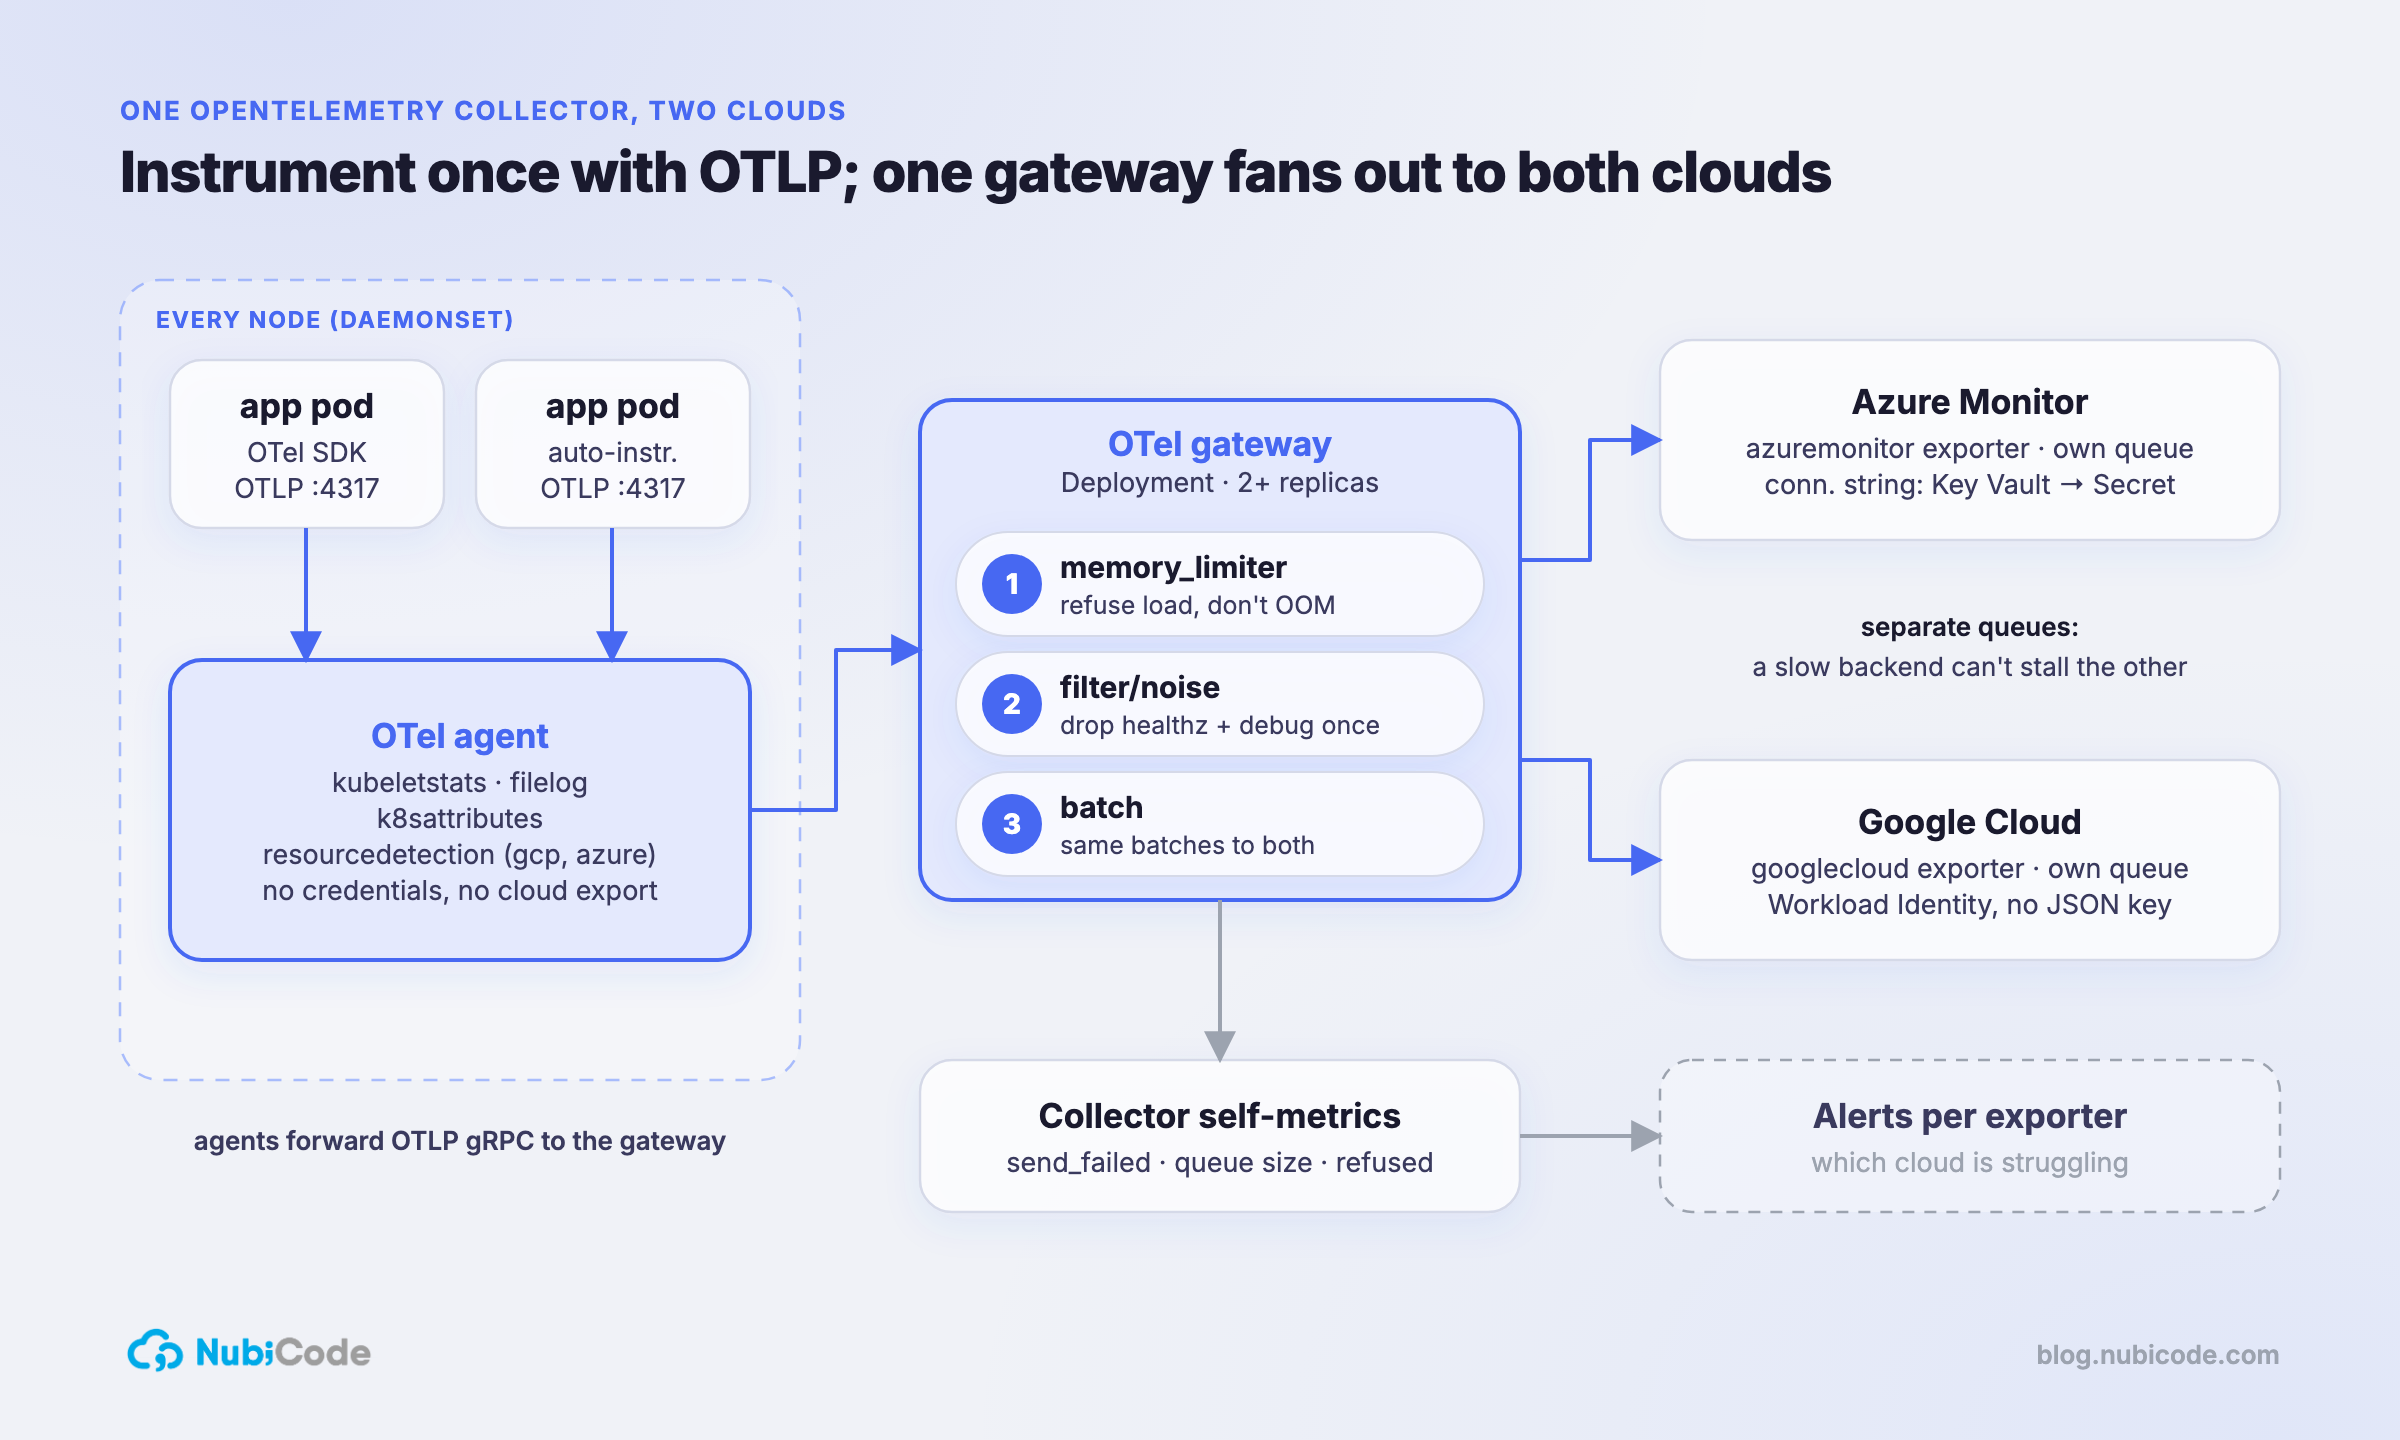
Instrument once: OTLP everywhere
Applications use the OpenTelemetry SDK for their language (or auto-instrumentation) and export to the node-local agent. The Downward API supplies the node IP:
env:
  - name: NODE_IP
    valueFrom:
      fieldRef: { fieldPath: status.hostIP }
  - name: OTEL_EXPORTER_OTLP_ENDPOINT
    value: "http://$(NODE_IP):4317"
  - name: OTEL_SERVICE_NAME
    value: "agent-runtime"
  - name: OTEL_RESOURCE_ATTRIBUTES
    value: "deployment.environment=prod,service.version=$(GIT_SHA)"
service.version is the Git SHA, the same value as the image tag (see immutable image tags). When a trace looks wrong in either console, you can go straight to the commit.
The agent: collect and enrich, don’t export
The agent config, trimmed:
receivers:
  otlp:
    protocols:
      grpc: { endpoint: 0.0.0.0:4317 }
      http: { endpoint: 0.0.0.0:4318 }
  kubeletstats:
    auth_type: serviceAccount
    endpoint: "https://${env:K8S_NODE_NAME}:10250"
    collection_interval: 30s
  filelog:
    include: [/var/log/pods/*/*/*.log]
    operators:
      - type: container

processors:
  memory_limiter: { check_interval: 1s, limit_percentage: 80, spike_limit_percentage: 20 }
  k8sattributes:
    extract:
      metadata: [k8s.namespace.name, k8s.pod.name, k8s.deployment.name, k8s.node.name]
  resourcedetection:
    detectors: [env, gcp, azure]
  batch: {}

exporters:
  otlp/gateway:
    endpoint: otel-gateway.observability.svc:4317
    tls: { insecure: true }   # in-cluster; mTLS via the mesh

service:
  pipelines:
    traces:  { receivers: [otlp],                processors: [memory_limiter, k8sattributes, resourcedetection, batch], exporters: [otlp/gateway] }
    metrics: { receivers: [otlp, kubeletstats],  processors: [memory_limiter, k8sattributes, resourcedetection, batch], exporters: [otlp/gateway] }
    logs:    { receivers: [otlp, filelog],       processors: [memory_limiter, k8sattributes, resourcedetection, batch], exporters: [otlp/gateway] }
Two details matter here:
memory_limitergoes first in every pipeline. When the gateway slows down, the agent refuses data instead of getting OOM-killed and taking a node’s worth of buffered telemetry with it.resourcedetectionwith bothgcpandazuredetectors. The same agent config runs on clusters in either cloud and tags telemetry withcloud.provider,cloud.regionand the cluster. You never maintain a per-cloud fork.
The gateway: one pipeline, two exporters
This is the part that makes it “one Collector, two clouds”:
receivers:
  otlp:
    protocols:
      grpc: { endpoint: 0.0.0.0:4317 }

processors:
  memory_limiter: { check_interval: 1s, limit_percentage: 80, spike_limit_percentage: 20 }
  filter/noise:
    error_mode: ignore
    traces:
      span:
        - 'attributes["http.route"] == "/healthz"'
        - 'attributes["http.route"] == "/readyz"'
    logs:
      log_record:
        - 'severity_number < SEVERITY_NUMBER_INFO'
  batch:
    send_batch_size: 8192
    timeout: 5s

exporters:
  azuremonitor:
    connection_string: "${env:APPLICATIONINSIGHTS_CONNECTION_STRING}"
    sending_queue: { enabled: true, num_consumers: 4, queue_size: 5000 }
  googlecloud:
    project: "${env:GCP_PROJECT_ID}"
    sending_queue: { enabled: true, num_consumers: 4, queue_size: 5000 }

service:
  pipelines:
    traces:  { receivers: [otlp], processors: [memory_limiter, filter/noise, batch], exporters: [azuremonitor, googlecloud] }
    metrics: { receivers: [otlp], processors: [memory_limiter, batch],               exporters: [azuremonitor, googlecloud] }
    logs:    { receivers: [otlp], processors: [memory_limiter, filter/noise, batch], exporters: [azuremonitor, googlecloud] }
  telemetry:
    metrics:
      level: detailed
Listing two exporters on a pipeline fans every batch out to both. Three things make that safe in production:
- A separate queue per exporter. Without
sending_queue, a slow or throttling backend pushes back on the whole pipeline, so an Azure ingestion hiccup would delay what reaches Google Cloud. With a queue each, the exporters drain on their own schedules. - Filtering happens once, before the fan-out. Health checks and debug logs are dropped in the gateway, so neither cloud ingests (or bills) them. Filtering per backend is how two consoles end up disagreeing.
- Batching happens once as well. Both exporters get identical batches. Only the final wire encoding is specific to each backend.
Credentials without long-lived keys in YAML
Each backend authenticates differently, and neither key goes in Git:
- Google Cloud: on GKE, the gateway’s Kubernetes service account is bound to a Google service account via Workload Identity, with
roles/monitoring.metricWriter,roles/cloudtrace.agentandroles/logging.logWriter. On clusters outside Google Cloud, Workload Identity Federation plus a credential config file (GOOGLE_APPLICATION_CREDENTIALS) does the same job without a JSON key. - Azure Monitor: the Application Insights connection string lives in Key Vault. External Secrets syncs it into a Kubernetes Secret that only the gateway mounts, as
APPLICATIONINSIGHTS_CONNECTION_STRING.
Rotating either credential restarts only the gateway pods. Agents and applications don’t change.
Watch the Collector itself
A telemetry pipeline that fails quietly is worse than none. The Collector exposes its own metrics (service.telemetry.metrics). We alert on three:
| Signal | Metric | Meaning |
|---|---|---|
| Export failures | otelcol_exporter_send_failed_spans / _metric_points / _log_records |
a backend is rejecting data |
| Queue pressure | otelcol_exporter_queue_size vs otelcol_exporter_queue_capacity |
a backend is slower than intake |
| Refused at intake | otelcol_receiver_refused_spans (and metrics/logs) |
memory_limiter is shedding load |
Break each one down by exporter so you can tell which cloud is struggling. Same idea as the GitOps setup: the platform’s health signals go through the same pipeline, and the ArgoCD sync alerts in GitOps with ArgoCD were shipped exactly this way.
Where the two backends differ
Same data in, but the two consoles don’t render it identically. Know this before someone files a bug:
- Naming. Application Insights maps spans onto its requests/dependencies model. Cloud Trace shows spans as spans. The trace IDs match, so correlate on trace ID, not on the UI’s labels.
- Metric types. Cloud Monitoring is strict about metric descriptors: changing a metric’s type or unit after first write is an error. Pick units and instrument types deliberately and version metric names if you need to change them.
- Cardinality costs. Both clouds bill on volume and series. A
user.idattribute on a metric doubles the damage when you export twice. Keep high-cardinality values on spans and logs, not on metric labels.
What we’d do differently
- Put the gateway tier in before the second cluster. Exporting straight from the agents works for one cluster, but it puts credentials on every node, and adding a gateway later means touching every cluster.
- Write down the attribute conventions before the first dashboard. Setting
service.name,deployment.environmentandservice.versionin one place (resource attributes) is what makes the two consoles line up. Ad hoc labels added per team never do. - Add a third exporter as a test, then remove it. Pointing a short-lived
debugorotlpexporter at a sandbox backend proves the fan-out works and that nobody depends on a vendor SDK.
Running telemetry across clouds without paying for it twice is the kind of platform work we do for US teams.
We do this for US teams.Senior nearshore engineers, US hours, AWS Partner, Vanta Partner.
Book a 30-minute architecture review